Virtual New Arrivals Program Map Tool
Designing a programmatic tool to track student locations and partnered schools for the Virtual New Arrivals program at the Victorian School of Languages. The tool utilized a database, geotracking, and mapping technologies to provide a user-friendly interface for teachers to plan visits and access student information.
Main Takeaways
- Implemented a responsive mapping interface using Mapbox GL with custom markers and interactive popups
- Designed a state management architecture with Redux for tracking selected pins, route data, and filter preferences
- Created an efficient data pipeline from Google Sheets to React application with caching for optimized performance
Introduction and Problem Statement
As a language teacher at the Virtual New Arrivals program, I recognized the need for a more efficient way to track student locations and partnered schools. With over 200 students across multiple schools, manual methods such as maps and pins were becoming increasingly difficult to manage. I proposed the development of a programmatic tool to address this challenge and improve the planning of teacher visits. The solution needed to handle complex geospatial data while providing an intuitive interface for non-technical staff. I chose React with Redux for state management due to the complexity of filtering teachers, schools, and visualizing connections between multiple locations on a dynamic map.
Technical Implementation
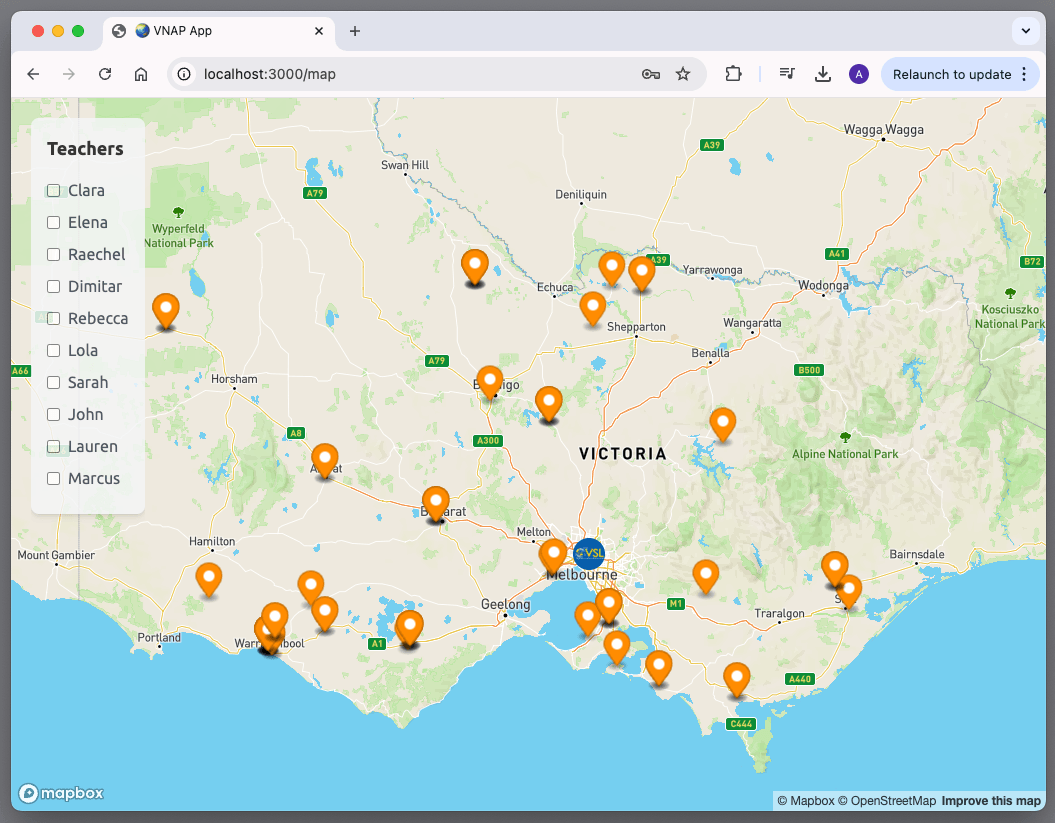
I began by creating a database in a Google Sheets spreadsheet to store teacher names, student names, and school names. I chose this so that it would be easily editable by teachers and admin staff without technical and programmatic knowledge. I then used geotracking extensions to programmatically insert the longitude and latitude of each school. A Google script was developed to send the data as an API call to a map tool application, which I built using React and Tailwind CSS. The application utilized Mapbox GL for rendering interactive maps with custom markers and popups. I implemented React's useRef hook to maintain references to map instances and markers for efficient rendering and cleanup, while ReactDOMServer allowed for rendering rich HTML content within map popups.
Data Import and Security
The map tool imported data from Google Sheets using the Fetch API with an endpoint created through Google Apps Script. As shown in the code, the application used a Redux-managed authentication system with SHA-256 hashing to protect access to the data. I implemented a conditional rendering pattern where the main map interface only loads after successful authentication, preventing unauthorized access to the school and student information. The PreMap component handles the initialization logic with a useRef-based flag to prevent duplicate data loading, optimizing the application's performance during navigation or state changes. This approach balanced security needs with ease of use for educators who needed quick access to location data.
Data Caching and Optimization
To address the issue of slow data loading, I implemented a caching function on the Google Script that cached the data in a JSON file every time the spreadsheet was altered. This ensured that the data was up-to-date and could be sent instantly when teachers logged in, reducing the need for repeated API calls. In regard to the visual UI, Map bounds were dynamically calculated based on visible markers with responsive padding adjustments for different screen sizes in Tailwind, ensuring optimal viewing regardless of device.
function updateCache() {
  const spreadsheet = SpreadsheetApp.getActiveSpreadsheet();
  const sheets = spreadsheet.getSheets();
  const fullData = {};

  sheets.forEach(sheet => {
    const data = sheet.getDataRange().getValues();
    const staffName = sheet.getName();

    if (data.length <= 1) return;

    for (let i = 1; i < data.length; i++) {
      const [staff, school, student, grade, lat, lng] = data[i];

      if (!fullData[school]) {
        fullData[school] = {
          staff: [],
          location: {
            lat: parseFloat(lat),
            lng: parseFloat(lng)
          }
        };
      }

      let staffEntry = fullData[school].staff.find(s => s.name === staffName);
      if (!staffEntry) {
        staffEntry = { name: staffName, students: [] };
        fullData[school].staff.push(staffEntry);
      }

      staffEntry.students.push({ name: student, grade: parseInt(grade, 10) });
    }
  });

  // Store the object as a JSON string in the script's properties
  const jsonData = JSON.stringify(fullData);
  PropertiesService.getScriptProperties().setProperty('cachedData', jsonData);
}
Additional Features and Functionality
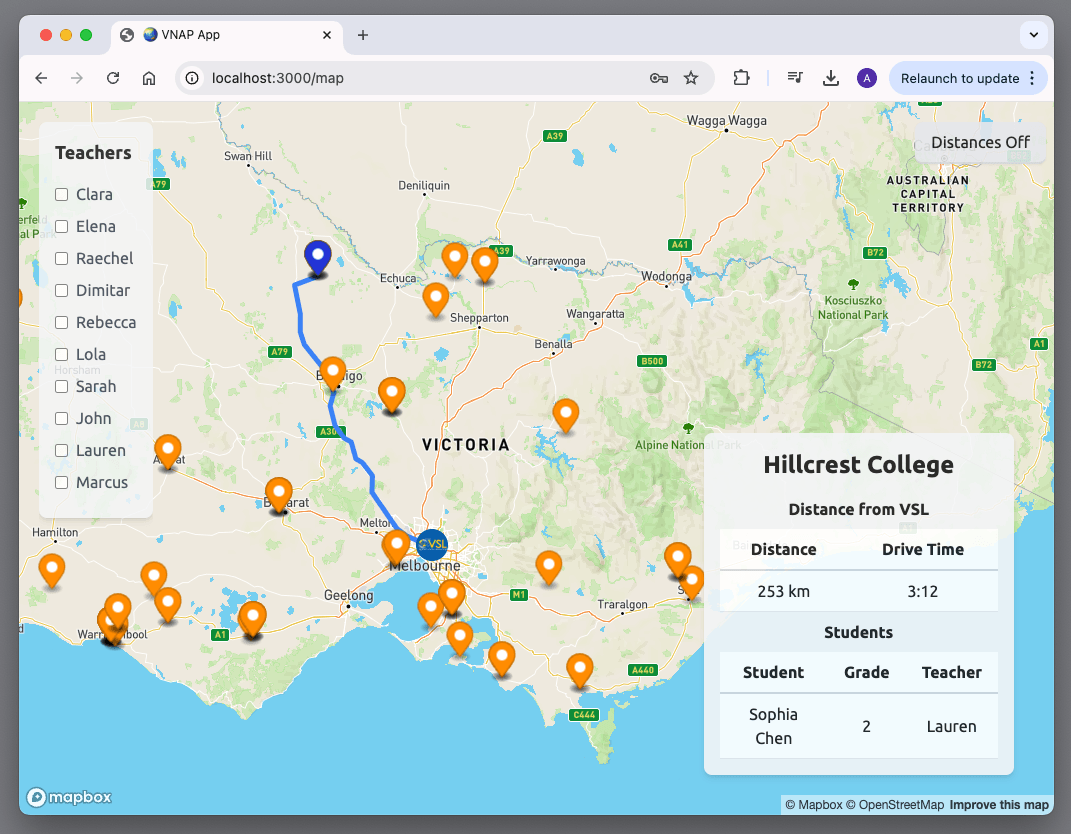
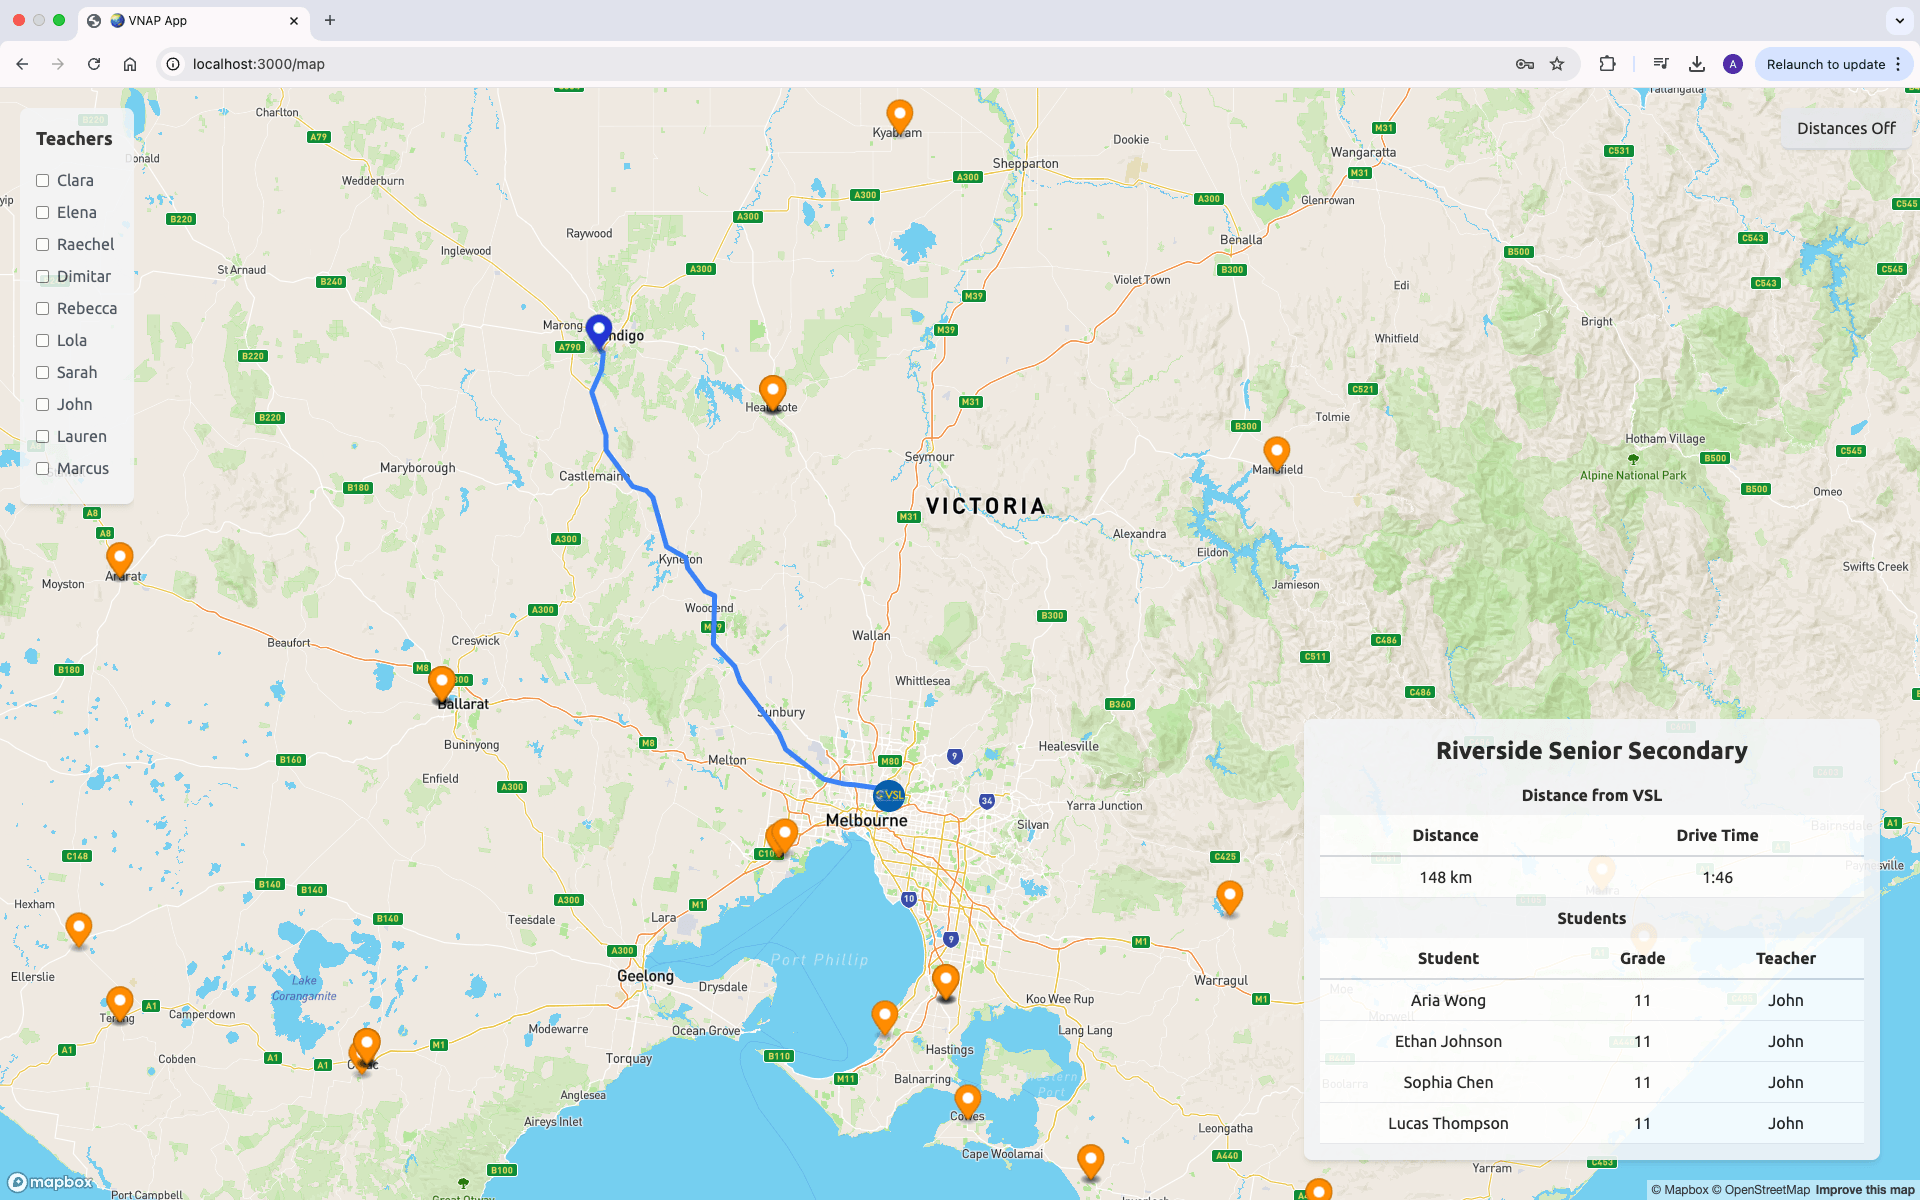
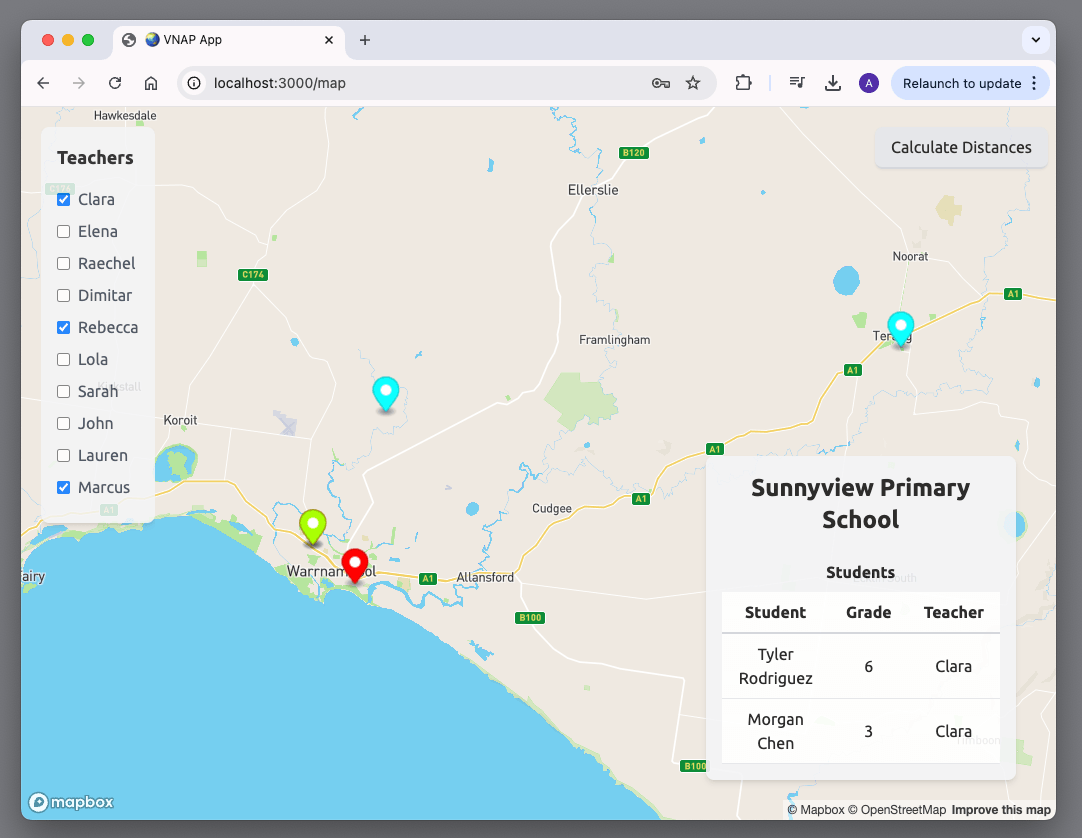
I added clickable elements to the map with event listeners for mouseenter, mouseleave, and click events that triggered different behaviors. For example, popup tooltips would appear on marker hover, providing basic school information, which could be expanded to more detailed information with a click, including teachers and enrolled student information.I included color-coding functionality that visually distinguished between different teachers' assignments, with dynamic highlighting of selected locations. As teachers would sometimes need to travel to visit partner schools, I implemented Mapbox's Directions API through custom functions like fetchDirectionsFromVSL and addRouteToMap, calculating and visualizing optimal routes between the Victorian School of Languages head office and school locations. This provided teachers with useful estimates of travel distances and times directly within the application interface.
Conclusion and Outcome
The Virtual New Arrivals program map tool was highly well-received by teachers, who found it to be a significant improvement over manual methods. The tool's ability to provide real-time information and optimize trip planning made it an invaluable resource for the program. Technical innovations like the dynamic route calculation, responsive design accommodations for mobile users, and the intuitive filtering system dramatically reduced the time required for planning school visits. By implementing conditional rendering of route layers based on user preferences (via the calculateDistanceOn state), the application maintained a clean interface while providing powerful functionality when needed. This project demonstrates effective application of web technologies to solve real educational administration challenges.
Technologies
- React
- Redux
- Mapbox GL
- Google Scripts
- Tailwind CSS
- Fetch API
- Geospatial Routing
Project Gallery


